To begin with, the JVM heap is physically divided in two: young generation and old generation. The young generation is reserved for new objects.
When it becomes full, garbage is collected (Garbage collector or GC) and the objects that have lived long enough are then moved to the old generation.
Finally, when the old generation space is full, the garbage collector runs removing the unused objects.
Garbage collection impacts on the application response time and cpu usage. Thus, this often leads to instability and to “out of memory exceptions”, generating failures in our app.
Consequently, in order to detect memory leaks (object references that are no longer needed which are unnecessarily maintained) and excessive garbage collection, we need to generate a memory dump and analyse it with the right tools.
It will be necessary to generate a heap dump of our java application, using jmap. We need to execute:
jmap -heap:format=b
where process-id is the PID of our java application.
The moment when we generate our dump is crucial because if we generate it when the application starts to run, it’s very likely that we won’t have enough information about the memory consumption of our application.
We can also tell the jvm to generate a dump when our app crashes due to an out of memory error, adding the following parameter:
-XX:+HeapDumpOnOutOfMemoryError
It’s recommended to always use this parameter in our production environment, so if our app crashes because of a memory error, we can analyze the dump at the moment the exception is raised.
We can analyze this dump using a different set of tools:
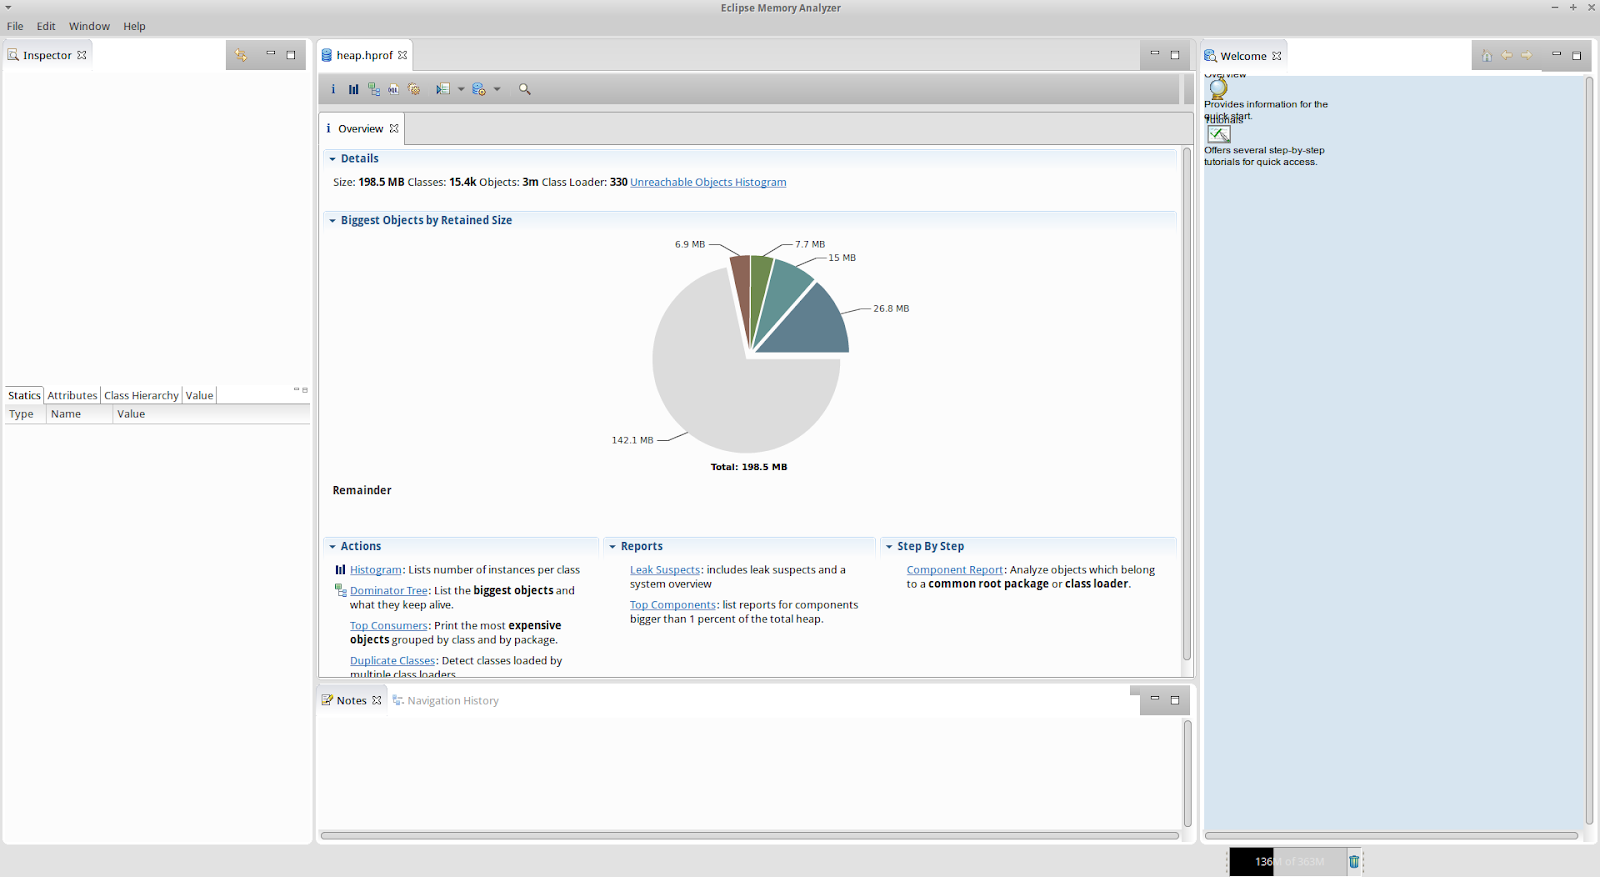
Memory Analyzer (MAT)
It's a tool that can provide us details of an application memory usage. It can generate reports of the memory leak suspects automatically, showing objects that are kept alive and are not yet collected.

When you open your heap dump, you can see a pie chart showing an overview of the application memory use.
We can also get a better sense of what objects currently exist in the memory, by using the histogram view.
Furthermore, this tool can use the OQL (sql-like language) to perform queries of our classes. For example, we can use:
select * from com.test.ClassOne
Finally, we can export our reports using the "export option." We can do it in several formats like HTML, CSV or TXT.
VisualVM

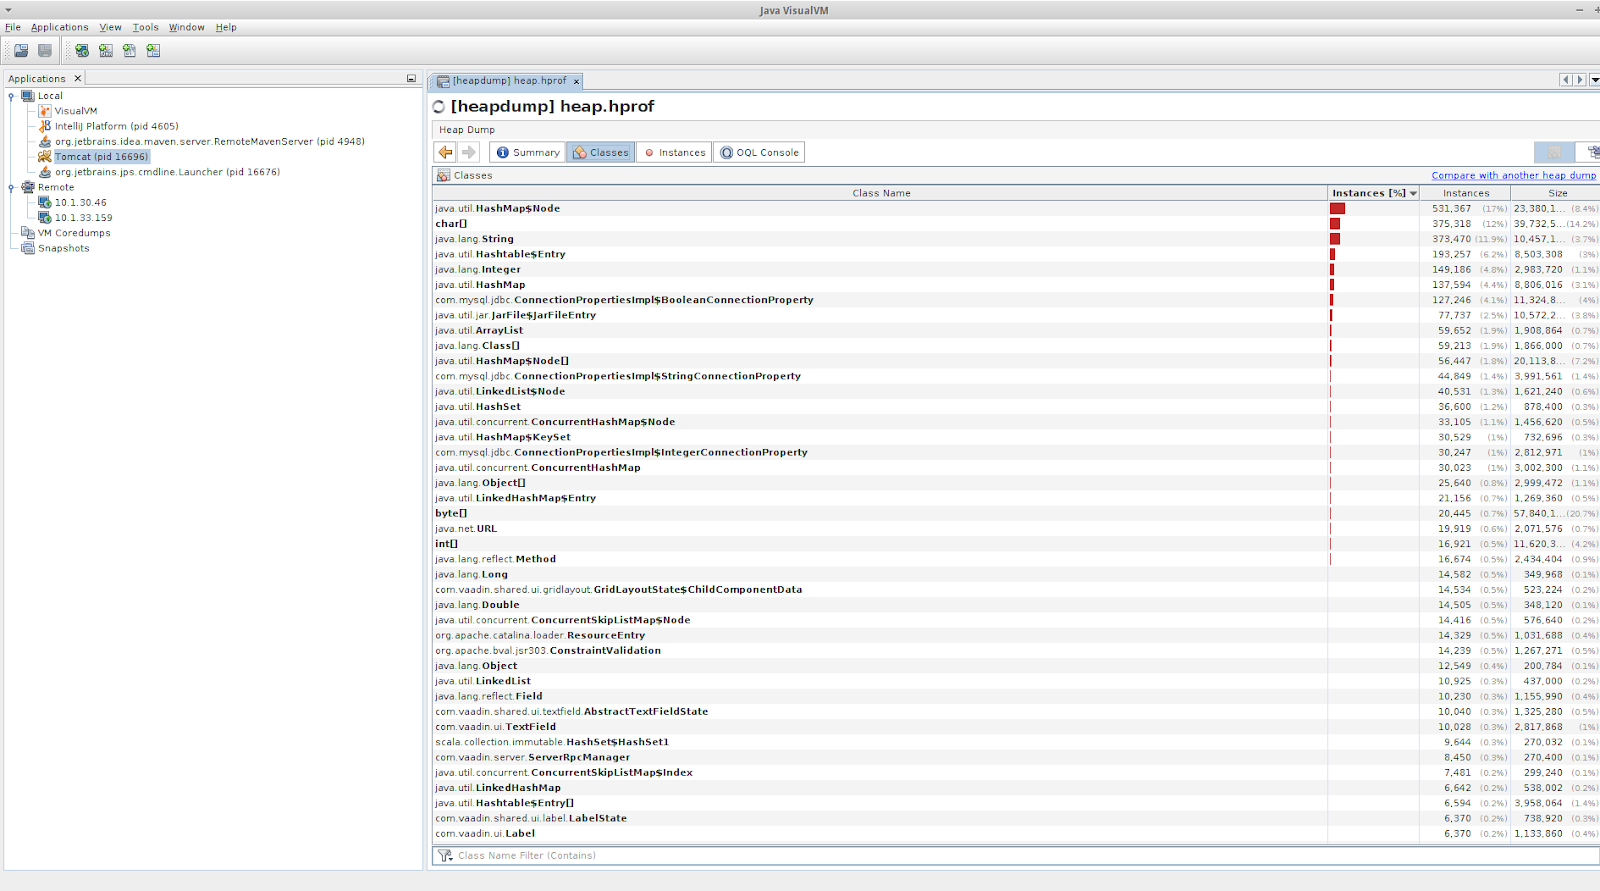
This tool integrates the commandline JDK analysis tools using a simple GUI with which we can quickly see the allocated objects in the heap.
In addition, it allows us to change between multiple views.
For instance:
- Summary, which shows the environment where the app was running and the system properties.
- Classes, including horizontal bar charts that graphically indicate the percentage of total instances that are associated with each class and environment;
- Instances, to see details of each individual instance of the current class.
Besides, this tool allows us to see all this analysis (plus cpu, gc activity, heap size with nice charts) in real time and with a remote java app (that can be running in a server, for example) but this analysis can’t be performed when our app has crashed.
Nevertheless, it's a great tool for monitoring live java apps.
YourKit

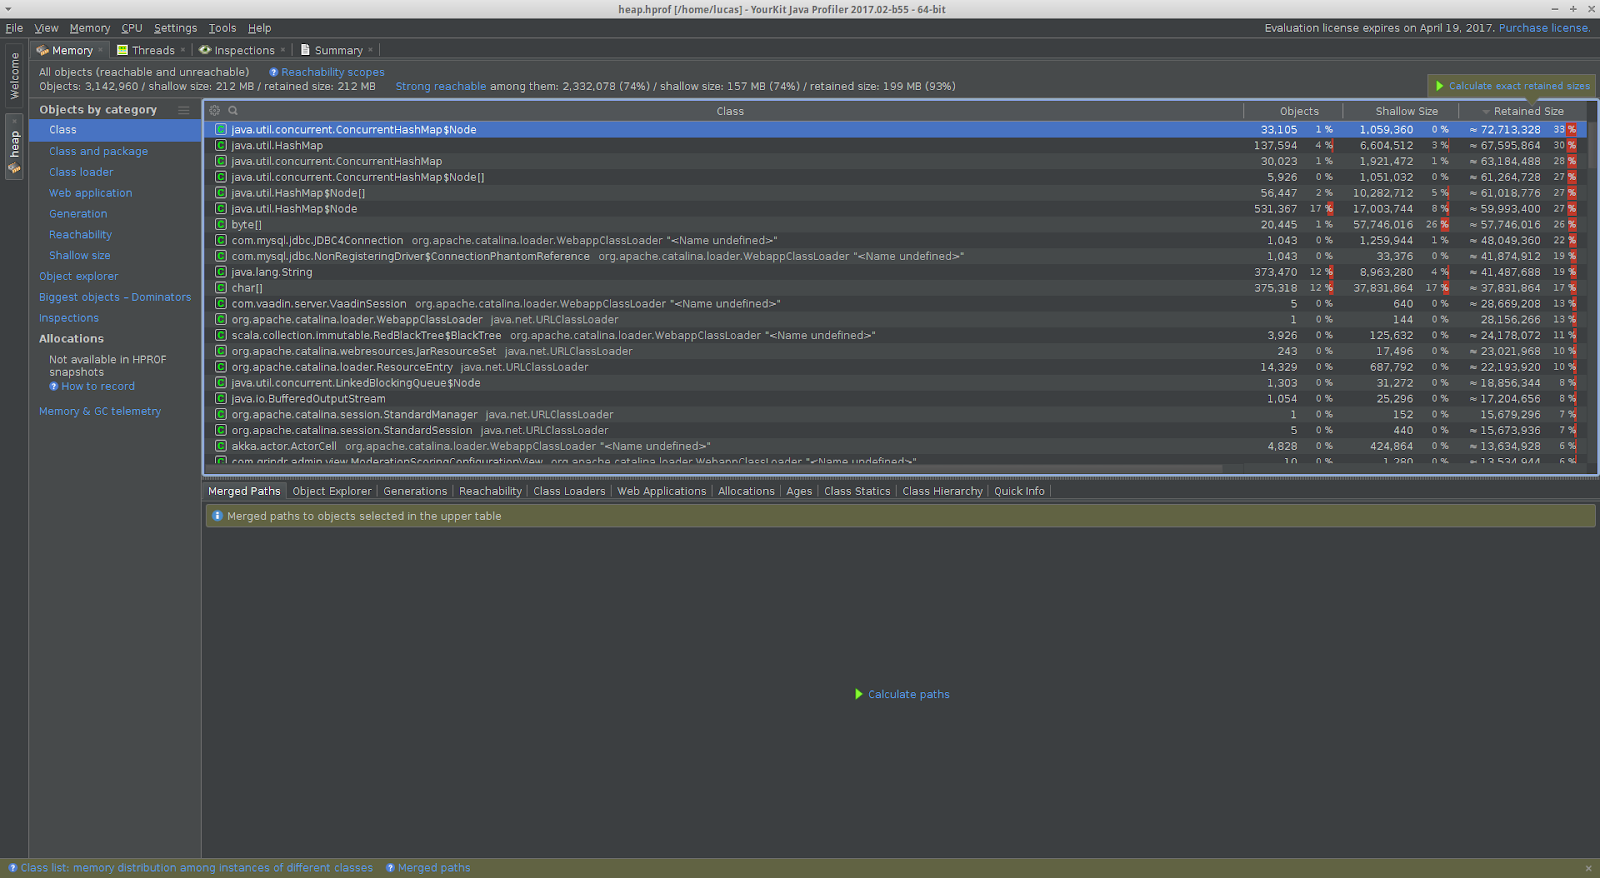
It’s a paid tool (we can get a free full license for 15 days). It’s a java profiler used to monitor the memory usage, cpu, threads, exceptions, deadlocks, etc in real time.
On the other hand, it gives us the option to open our memory dumps showing us the classes and objects with their sizes, the threads, a summary, and options to run specific inspections in our dump, for instance, duplicate objects, data duplication inside objects, possible leaks and other memory oddities like self referencing objects.
The disadvantage of this tool is that when we open a dump, we lose all the great options that this tool gives us for real time monitoring, because, as we said before, this tool is more a profiler than a heap dump analysis tool.
Conclusion
A heap dump analysis is not a replacement for profiling our java app, but a complement. It is particularly useful when troubleshooting Java heap memory leaks and out of memory exceptions.
Additionally, we need to take into account that a very big heap dump requires a lot of memory in the machine where the analysis is performed.
But if we can find and face the problem, we should see a clear improvement in the performance of our app.


